

Introduction/Background
Infant mortality is the death of an infant within the first year of life and continues to be a very prominent public health issue within developed nations such as the United States (Centers for Disease Control and Prevention (CDC), 2020). Analyzing infant mortality within a population is a useful method for evaluating population health, which is defined as the health outcomes of a group of individuals, such as a geographic population, and the distribution of health outcomes within this group (Institute for Healthcare Improvement, 2021). Infant mortality is often analyzed by calculating an infant mortality rate, which is the number of infant deaths within a population for every 1,000 live births (CDC, 2020). Infant mortality rates are useful indicators of population health because they vary drastically between populations, but the reasoning behind these variations is still unknown (CDC, 2020).
The United States has one of the highest infant mortality rates among developed countries with a rate of 5.7 in 2020 (CDC, 2020), compared to an average of 3.4 from comparable countries in 2017 (Peterson-Kaiser Family Foundation [KFF], 2019). Just as these rates vary by country, they also vary by state and even county. For example, Michigan is well above the United States’ average with an infant mortality rate of 6.22 in 2018 (CDC, 2018). In addition to variations based on geographic population, infant mortality rates also vary based on social factors such as maternal race and ethnicity. In 2017, infants born to Black, non-Hispanic mothers in the United States experienced an infant mortality rate of 10.97, whereas the average rate for infants born to mothers of all races and ethnicities was only 5.79 (Peterson-KFF, 2019). While the reason for this variation based on population remains unclear, it is hypothesized that social determinants of health play a large role.
Social determinants of health are conditions in people’s lives that affect health risks and outcomes and are divided into five categories: economic stability, education access and quality, healthcare access and quality, neighborhood and built environment, and social and community context (United States Department of Health and Human Services [USDHHS], 2021). Most previous research suggests that social determinants of health may contribute to variations in infant mortality by qualitatively assessing this relationship through systematic reviews, case studies, and “calls to action.” For example, one study acknowledged that social determinants of health are likely primary contributors to infant mortality and suggested potential interventions such as improving perinatal health outcomes, improving women’s health prior to pregnancy, and promoting quality healthcare services (Lu & Johnson, 2014). However, this study only addressed hypothetical solutions by qualitatively assessing which social determinants should be targeted to improve health outcomes for infants. In addition, one scoping review found that this is a common theme for most infant mortality research regarding social determinants of health, as most articles focused qualitatively on individual and public policy level interventions (Reno & Hyder, 2018). The authors, therefore, suggested that more research needs to quantitatively analyze the social determinants of health that previous research has hypothesized to affect infant mortality rates (Reno & Hyder, 2018).
Contrary to this previous research, the goal of this study was to take a more quantitative approach to determine whether particular determinants have more influence than others because even in populations with very different social determinants of health, infant mortality continues to be a public health crisis. For example, Washtenaw County, Michigan, which houses the University of Michigan in Ann Arbor, and Wayne County, Michigan, which includes the city of Detroit, are very different demographically despite sharing a border, as Wayne County has much higher rates of poverty, unemployment, percent uninsured, and much more diversity in terms of race and educational attainment (United States Census Bureau [USCB], 2018). Despite these demographic differences, the Community Health Needs Assessments (CHNAs) for both counties drew similar conclusions. CHNAs are mandatory territorial health assessments conducted by local hospitals that identify primary health needs and issues of a community (CDC, 2021). The CHNAs for both Washtenaw County (Michigan Medicine et al., 2021) and Wayne County (Henry Ford Health System, 2019) identified preconceptual and perinatal health as a primary concern for the community, despite Washtenaw County having an infant mortality rate of 5.4 in 2018 (MDHHS, 2018), which is below the Michigan average, and Wayne County having an infant mortality rate of 10.7 in 2018 (MDHHS, 2018), which is higher than the Michigan average.
This study aimed to determine whether differences in the social determinants of health in populations can be used to explain differences in infant outcomes and whether one determinant could be best used to explain these differences. For example, does the higher poverty rate in Wayne County correlate to its higher infant mortality rate? Is infant mortality most directly correlated to unemployment rate? If so, would addressing issues regarding the unemployment rate help to decrease infant mortality rates? Based on these questions, it was hypothesized that by studying these two demographically different populations with two different infant mortality rates, the difference in infant mortality could be attributed to the social determinants of health that vary between these populations. Therefore, if it can be determined that particular determinants have a more significant influence on infant mortality rates than others, then vulnerable populations can be more easily identified, and implementation efforts can be better catered to these populations and their needs.
Methods
To analyze various social determinants of health and their effect on infant mortality rates,Washtenaw County, Michigan, and Wayne County, Michigan, were compared due to their differences regarding their average infant mortality rates and various social determinants of health. Because social determinants of health are divided into five categories—economic stability, neighborhood and built environment, healthcare access and quality, social and community context, and education access and quality (USDHHS, 2021)—data published by the USCB were collected that fell into at least four of the five categories. These data included poverty rate, unemployment rate, percentage uninsured, race, and educational attainment per each county’s total population from 2010 to 2018 and are represented in Tables 1 and 2. This time period was chosen because the Patient Protection and Affordable Care Act (PPACA) mandated CHNAs for hospitals in 2010, and these CHNAs are usually followed by implementation plans (Michigan Medicine, 2021). Therefore, the period 2010–2018 would reveal any effects of implementation efforts that have been achieved thus far regarding infant mortality rates.
For the first analysis, with data displayed in Table 1, poverty rate was analyzed using the general population poverty rate, and race was divided into four categories: White, Black, Asian, and other, with the “other” category including Hispanic/Latino, American Indian and Alaskan Native, Native Hawaiian and other Pacific Islander, and two or more races. Education was also divided into four categories: less than high school, high school or equivalent degree, some college, and college degree or more. To analyze any significant differences between the social determinants of health data for the two counties, each determinant for each county was compared to the same determinant for the other county using independent t-tests. P-values were then calculated, as displayed in Table 1, and any p-value less than 0.05 was considered statistically significant.
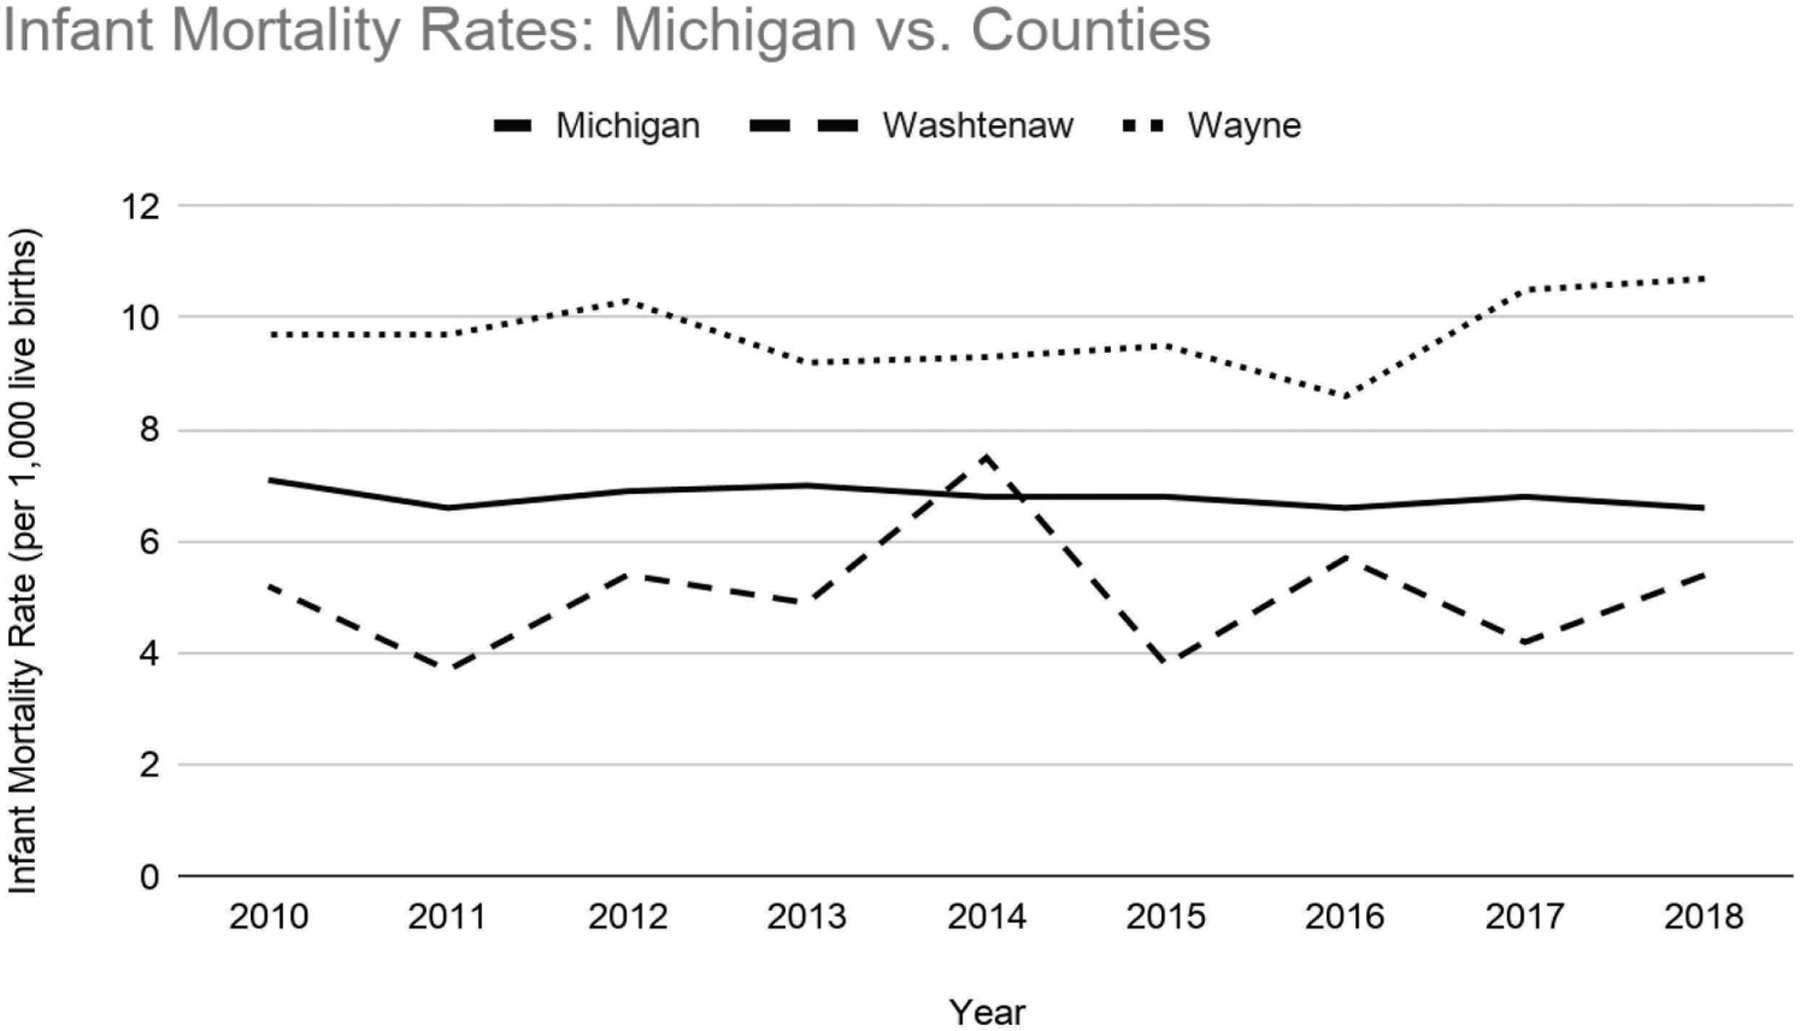
Graph of infant mortality rates (per 1,000 live births) for Washtenaw County (MDHHS, 2018), Wayne County (MDHHS, 2018), and the state of Michigan (MDHHS, 2018) from 2010 to 2018.
For the second analysis, with data displayed in Table 2, some of the social determinants of health were defined differently, so the data were more condensed for the binomial regression. For example, race was reduced to only two categories: White and non-White. In addition, education was also reduced to only two categories: high school/equivalent degree or less and some college education or more. Infant mortality rate data were then collected for both counties, as well as the state of Michigan, from data published by the Michigan Department of Health and Human Services (MDHHS) from 2010 to 2018 and are represented in Figure 1 and Table 2. Each social determinant of health and the corresponding infant mortality rate for each county was assessed utilizing a binomial regression to evaluate if each determinant could be used to explain variation in infant mortality. P-values were calculated once again, as displayed in Table 2, and any p-value less than 0.05 was considered statistically significant.
Results
Figure 1 depicts the infant mortality rates for Washtenaw County, Wayne County, and the state of Michigan from 2010 to 2018. The state of Michigan’s average is steady and consistent around a rate of 7. Wayne County’s average rate is consistent around 10, which is well above the Michigan average. Washtenaw County’s average rate is less consistent, varying mostly between 4 and 6 over the eight-year span. Washtenaw’s rate peaked at around 8 in 2014, which is above the Michigan average, but it is well below the Michigan average every other year.
Social determinants of health data including means, ranges, and p-values from independent t-tests for Washtenaw County, Michigan, and Wayne County, Michigan, from 2010 to 2018 (USCB, 2018). P-values less than 0.05 are considered statistically significant.
| Social Determinants of Health for Washtenaw and Wayne County, Michigan (2010–2018) | |||||
|---|---|---|---|---|---|
| Determinants | Statistics | Washtenaw | Wayne | P-value | |
| Poverty Rate | Mean | 15.04 | 24.06 | <0 .00001 | |
| Range | 12.90–16.90 | 21.60–26.20 | |||
| Unemployment Rate | Mean | 6.690 | 13.70 | 0.001083 | |
| Range | 3.600–10.20 | 7.900–21.50 | |||
| Uninsured Rate | Mean | 5.578 | 10.60 | 0.006280 | |
| Range | 2.700–8.500 | 5.900–15.60 | |||
| Race Percentages | White | Mean | 74.00 | 53.10 | <0 .00001 |
| Range | 73.35–74.68 | 52.37–53.54 | |||
| Black | Mean | 11.98 | 39.38 | <0 .00001 | |
| Range | 11.47–12.47 | 38.54–40.51 | |||
| Asian | Mean | 8.572 | 2.972 | <0 .00001 | |
| Range | 7.700–9.810 | 2.520–3.400 | |||
| Other | Mean | 1.214 | 2.191 | <0 .00001 | |
| Range | .9800–1.500 | 1.770–2.410 | |||
| Education Percentages | Less than High School | Mean | 5.096 | 14.67 | <0 .00001 |
| Range | 4.310–6.340 | 13.08–16.11 | |||
| High School or Equivalent | Mean | 15.34 | 30.25 | <0.00001 | |
| Range | 14.25–16.86 | 29.68–30.89 | |||
| Some College | Mean | 25.69 | 32.55 | <0.00001 | |
| Range | 24.23–27.41 | 32.00–33.24 | |||
| College or More | Mean | 53.87 | 22.52 | <0.00001 | |
| Range | 50.22–56.96 | 21.05–25.21 | |||
Table 1 depicts social determinants of health data for both Washtenaw and Wayne County, including poverty rate, uninsured rate, and percentages for race and educational attainment. P-values are also depicted, and every p-value for every determinant comparison between the two counties is much lower than 0.05. This means that all these social determinants of health are significantly different between the two counties.
Social determinants of health data (USCB, 2018) and infant mortality rate data for Washtenaw County, Michigan (MDHHS, 2018), and Wayne County, Michigan (MDHHS, 2018), from 2010 to 2018, including means, ranges, and p-values from binomial regressions. P-values less than 0.05 are considered statistically significant.
| Social Determinants of Health versus Infant Mortality for Washtenaw and Wayne County, Michigan (2010–2018) | ||||||
|---|---|---|---|---|---|---|
| County | Determinants | Statistics | Determinants | Infant Mortality Rate | P-value | |
| Washtenaw | Poverty Rate | Mean | 15.04 | 5.089 | 0.665 | |
| Range | 12.90–16.90 | 3.7–7.5 | ||||
| Unemployment Rate | Mean | 6.690 | 5.089 | 0.534 | ||
| Range | 3.600–10.20 | 3.7–7.5 | ||||
| Uninsured Rate | Mean | 5.578 | 5.089 | 0.456 | ||
| Range | 2.700–8.500 | 3.7–7.5 | ||||
| Race Percentages | White | Mean | 74.00 | 5.089 | 0.799 | |
| Range | 73.35–74.68 | 3.7–7.5 | ||||
| Non-White | Mean | 26.00 | 5.089 | 0.799 | ||
| Range | 25.32–26.65 | 3.7–7.5 | ||||
| Education Percentages | High School or Less | Mean | 20.43 | 5.089 | 0.596 | |
| Range | 18.78–23.20 | 3.7–7.5 | ||||
| College or More | Mean | 79.57 | 5.089 | 0.600 | ||
| Range | 76.80–81.21 | 3.7–7.5 | ||||
| Wayne | Poverty Rate | Mean | 24.06 | 9.722 | 0.697 | |
| Range | 21.60–26.20 | 8.600–10.70 | ||||
| Unemployment Rate | Mean | 13.70 | 9.722 | 0.725 | ||
| Range | 7.900–21.50 | 8.600–10.70 | ||||
| Uninsured Rate | Mean | 10.60 | 9.722 | 0.786 | ||
| Range | 5.900–15.60 | 8.600–10.70 | ||||
| Race Percentages | White | Mean | 53.10 | 9.722 | 0.676 | |
| Range | 52.37–53.54 | 8.600–10.70 | ||||
| Non-White | Mean | 46.90 | 9.722 | 0.676 | ||
| Range | 46.46–47.63 | 8.600–10.70 | ||||
| Education Percentages | High School or Less | Mean | 44.92 | 9.722 | 0.423 | |
| Range | 42.78–46.61 | 8.600–10.70 | ||||
| College or More | Mean | 55.07 | 9.722 | 0.426 | ||
| Range | 53.38–57.21 | 8.600–10.70 | ||||
Table 2 depicts both infant mortality and social determinants of health data, including poverty rate, unemployment rate, percent uninsured, and race and education percentages for both Washtenaw and Wayne County. The table also displays p-values from the binomial regressions. All p-values are greater than 0.05, meaning that there is no significant correlation between any social determinants and infant mortality for either county.
Discussion
As depicted in Table 1, Wayne County has much higher rates of poverty, unemployment, percent uninsured, and much more diversity in terms of race and educational attainment (USCB, 2018). These differences in social determinants of health between the two populations were found to be significantly different, as all the p-values from independent t-tests in Table 1 are less than 0.05, indicating that Wayne County has significantly higher rates of poverty, unemployment, and percent uninsured, significantly more racial diversity, and significantly lower educational attainment, making this population more vulnerable than that of Washtenaw County to facing systemic health inequities.
Despite these demographic differences, as well as the differences in infant mortality rates as depicted in Figure 1 and Table 2, the CHNAs for both Washtenaw County (Michigan Medicine et al., 2021) and Wayne County (Henry Ford Health System, 2019) identified preconceptual and perinatal health as a primary concern for the community. From the first analysis, the infant mortality rates for the two counties were found to be significantly different from one another, as Washtenaw County had an infant mortality rate of 5.4 in 2018 (MDHHS, 2018), which is below the Michigan average, and Wayne County had an infant mortality rate of 10.7 in 2018 (MDHHS, 2018), which is higher than the Michigan average. Looking at these rates over time from 2010 to 2018 in Figure 1, although there is some minor fluctuation, the infant mortality rate for Wayne County was consistently higher than the state of Michigan average, whereas the infant mortality rate for Washtenaw County was consistently lower than the Michigan average.
Because both the social determinants of health and the infant mortality rates between the two counties were found to be significantly different from one another, the hypothesis remained that the variation in social determinants of health could be used to explain the variation in infant mortality rates. However, after assessing the association between the infant mortality rates and each social determinant of health for both counties, all the p-values were found to be much greater than 0.05, as displayed in Table 2. This means that no association was found between the infant mortality rates and any one specific social determinant of health for either county. This does not indicate, however, that social determinants of health are not a contributing factor to variation in infant mortality, but only that of the five social determinants studied in this analysis over the course of 2010 to 2018, none are directly associated with these variations.
As previously mentioned, this study is one of the first to quantitatively analyze the effects of social determinants of health on infant mortality, and there are several limitations that could have impacted these results. For example, only five specific social determinants of health were chosen for this study, and there are many others that could be impactful on infant mortality as well; perhaps other determinants such as distance from a hospital or methods of transportation could be considered for future studies. In addition, this study only ran binomial regressions between each social determinant and the infant mortality rates. It is likely that many social determinants overlap to influence high infant mortality rates, so future studies could conduct multiple linear regressions analyzing multiple social determinants of health together or controlling for confounding variables. Lastly, data for both infant mortality and the social determinants of health were gathered for the years 2010 to 2018, which is only an eight-year window. Perhaps by gathering more data over a longer period of time, different trends may appear in the results.
Conclusion
Based on this analysis, no single social determinant of health was found to be associated with infant mortality variation for Washtenaw or Wayne County, despite the significant differences between the two populations. This means that one social determinant of health is not likely to be a good predictor of infant outcomes. Instead, high infant mortality rates are likely a result of interactions between several determinants that, together, increase an infant’s risk. Therefore, simultaneous targeting of multiple determinants is necessary to implement meaningful interventions. According to the CHNAs for both Washtenaw and Wayne County, local hospitals are already making efforts to do so. For example, Washtenaw County has initiated a Centering Pregnancy program in which a small group of low-income expectant mothers with similar due dates receive group prenatal support programming (Michigan Medicine et al., 2021). By promoting more prenatal education, more interaction between patients and caregivers, as well as interactions between patients in similar circumstances, babies delivered to Centering Pregnancy mothers have experienced decreased infant mortality and low birth rate and increased breastfeeding uptake (Michigan Medicine et al., 2021).
Wayne County has made similar efforts by initiating a program in Detroit to help pregnant and nonpregnant Black women address the social determinants of health that may lead to preterm and low birth rate deliveries (Henry Ford Health System, 2019). This program does so by increasing awareness of the disparities that exist regarding infant mortality, the importance of pre- and interconception health, and education regarding topics related to pregnancy, birth, and parenting such as breastfeeding, proper nutrition, making a birth plan, and common pregnancy discomforts (Henry Ford Health System, 2019). Similar to the Washtenaw program, this group-based prenatal care also brings together women of similar gestational ages and allows for more prenatal education and more interaction between patients and their caregivers (Henry Ford Health System, 2019). However, this program also implements home visits with patients to provide extra support until the baby turns 1 year old, which is the age limit for measuring infant mortality (Henry Ford Health System, 2019). This model, more so than that of Washtenaw, addresses additional social determinants of health such as limited transportation and distance from healthcare facilities. As a result, this program has seen zero preventable infant deaths among group prenatal care participants and better-than-average rates of low birthweight births and preterm births since 2016 compared to Michigan and Detroit averages (Henry Ford Health System, 2019).
Based on the short-term results of programs like these, infant mortality is a public health crisis that can be prevented if proper steps are taken to ensure every expecting mother of all incomes, races, insurance statuses, education backgrounds, and so on is given not equal but equitable treatments based on their needs. More programs like these need to be implemented in disadvantaged communities, and as these programs age and evolve, further research should be conducted to evaluate long-term trends and effects of targeting multiple social determinants of health on infant mortality. This research should also be expanded to other health outcomes as well, not just infant mortality, as disparities in health outcomes exist in many different forms, including maternal mortality, substance abuse disorders, suicide rates, and so on. To truly implement meaningful interventions for any public health crisis, research and efforts need to be focused on the simultaneous targeting of various social determinants of health. By better understanding how these determinants affect the risk of infant mortality, more focused efforts can be made to address these determinants for vulnerable populations.
References
Centers for Disease Control and Prevention. (2018). Infant mortality rates by state [Interactive map]. CDC. gov. https://www.cdc.gov/nchs/pressroom/sosmap/infant_mortality_rates/infant_mortality.htmhttps://www.cdc.gov/nchs/pressroom/sosmap/infant_mortality_rates/infant_mortality.htm
Centers for Disease Control and Prevention. (2020, September 10). Infant mortality. CDC.gov. https://www.cdc.gov/reproductivehealth/maternalinfanthealth/infantmortality.htm#:~:text=In%20addition%20to%20giving%20us,the%20United%20States%2C%202018https://www.cdc.gov/reproductivehealth/maternalinfanthealth/infantmortality.htm#:~:text=In%20addition%20to%20giving%20us,the%20United%20States%2C%202018
Centers for Disease Control and Prevention. (2021). What is a community health assessment? CDC.gov. https://www.cdc.gov/publichealthgateway/cha/plan.htmlhttps://www.cdc.gov/publichealthgateway/cha/plan.html
Henry Ford Health System. (2019). Community Health Needs Assessment 2019. HenryFord.com. https://www.henryford.com/-/media/files/henry-ford/about/community/chna-2019-final-henryfordcom.pdf?la=en&hash=970B01A7591C24F654C36D4AC8653D21https://www.henryford.com/-/media/files/henry-ford/about/community/chna-2019-final-henryfordcom.pdf?la=en&hash=970B01A7591C24F654C36D4AC8653D21
Institute for Healthcare Improvement. (2021). Population health. IHI.org. http://www.ihi.org/Topics/Population-Health/Pages/default.aspxhttp://www.ihi.org/Topics/Population-Health/Pages/default.aspx
Lu, M. C., & Johnson, K. A. (2014). Toward a national strategy on infant mortality. American Journal of Public Health, 104(S1), S13–S16. https://doi.org/10.2105/AJPH.2013.301855https://doi.org/10.2105/AJPH.2013.301855
Michigan Department of Health and Human Services. (2018a). Infant deaths, live births and infant death rates, Washtenaw County residents, 1989–2018, single year [Data set]. https://vitalstats.michigan.gov/osr/chi/Indx/frame.htmlhttps://vitalstats.michigan.gov/osr/chi/Indx/frame.html
Michigan Department of Health and Human Services. (2018b). Infant deaths, live births and infant death rates, Wayne County residents, 1989–2018, single year [Data set]. https://vitalstats.michigan.gov/osr/chi/Indx/frame.htmlhttps://vitalstats.michigan.gov/osr/chi/Indx/frame.html
Michigan Medicine. (2021). Community health needs assessment. UofMHealth.org. https://www.uofmhealth.org/community-health-needs-assessmenthttps://www.uofmhealth.org/community-health-needs-assessment
Michigan Medicine, St. Joseph Mercy Ann Arbor, & St. Joseph Mercy Chelsea. (2021). 2021 Community health needs assessment. UofMHealth.org. http://www.med.umich.edu/pdf/2021-CHNA.pdfhttp://www.med.umich.edu/pdf/2021-CHNA.pdf
Peterson-Kaiser Family Foundation. (2019, October 18). What do we know about infant mortality in the U.S. and comparable countries? Healthsystemtracker.org. https://www.healthsystemtracker.org/chart-collection/infant-mortality-u-s-compare-counries/#item-starthttps://www.healthsystemtracker.org/chart-collection/infant-mortality-u-s-compare-counries/#item-start
Reno, R., & Hyder, A. (2018). The evidence base for social determinants of health as risk factors for infant mortality: A systematic scoping review. Journal of Health Care for the Poor and Underserved, 29(4), 118–1208. https://doi.org/10.1353/hpu.2018.0091https://doi.org/10.1353/hpu.2018.0091
United States Census Bureau. (2018). 2018: ACS 1-year estimates subject tables (S1701) [Data set]. American Community Survey. https://data.census.gov/cedsci/table?q=poverty%20by%20race&t=Poverty&g=0500000US26161,26163&tid=ACSST1Y2018.S1701&hidePreview=truehttps://data.census.gov/cedsci/table?q=poverty%20by%20race&t=Poverty&g=0500000US26161,26163&tid=ACSST1Y2018.S1701&hidePreview=true
United States Department of Health and Human Services. (2021). Social determinants of health. Health. gov. https://health.gov/healthypeople/objectives-and-data/social-determinants-health.https://health.gov/healthypeople/objectives-and-data/social-determinants-health